Idea of the Week – Peter Wilson
One of the informal benchmarks for a conference presentation is the number of tweets referencing it – and what they say, of course. The presentation Peter Wilson gave at Respond prompted many tweets, almost all of them expressing some surprise at how little they knew about HTTP2 and how clearly important it is.
And that’s why Peter’s presentation is our Idea of the Week. We know too little about web performance in general and we need to know much more about the transition to HTTP2.
You can also read this abbreviated version of his live presentation in the first edition of our rebooted Scroll Magazine.
Performance: HTTP2 in a 1.5 World
For most of us, the year 1969 is incredibly important. In some ways, it could be seen as the most important year of our working lives, even though – for many of us, anyway – it happened some time before we were born.
At around 9:30 on the night of 29 October 1969, a group of researchers from UCLA sent the first message on the ARPANET, predecessor to the internet, to the University of Stanford in San Francisco.
That message, sent about half the length of California, was simple: “login”.
With the sending of that five letter message the path to the internet and, eventually, the World Wide Web, had begun. It was an inauspicious beginning, because the message that actually made it to Stanford was: “lo”.
Yes. Performance issues have been with us from the start.
Performance is a two part issue
I started developing sites in the 1990s. Back then, we had a maximum download speed of 56 kilobits per second. Very much a theoretical maximum, at best. When this old man talks about caring about every byte on a page back in the day, it’s because we had no choice.
I still think about bytes on the page in my role as WordPress engineer at Human Made [https://hmn.md/is/], making high-end WordPress sites, often using it as a headless CMS and delivering content via an API.
As far as performance goes, we’re now in a transitional period. With the release of the spec for HTTP version 2 and increasing but not universal browser support, we need to consider how server configuration influences the performance of our front-end code.
Because we’re in transition, code for one circumstance may cause problems for another. We find ourselves in dire straits. However, as professional web designers and developers we don’t get our money for nothing, or – in terms of conversions – our clicks for free. We need to accept that front-end code and HTTP protocols have become the brothers in arms of performance. (Thank you, thank you, I’ll be here til Thursday.)
The internet is slow
Since late 2011, the HTTP Archive – run by the Internet Archive – has collected statistics on the Alexia top one million sites. Dozens of data points are collected visiting the one million sites both on a desktop using broadband and on a mobile phone simulating a mobile connection.
The stated aim is to record not just the content in the Internet Archive, but how this content is delivered and served in the HTTP Archive. It focuses our attention on the state of front end web development, including how we as designers and developers are changing the web.
With this focus on the front end, let’s take a look at what has happened to bytes on the page in recent years.
In April last year, we passed an average of 2 megabytes per page and we have not looked back. We currently sit at a little under 2.3 Mb per page and we will pass an average of 2.5 Mb by the end of this year. That’s for every page.
Mobile users fare slightly better with the current average weight of a page accessed via a mobile device sitting at 1.2 Mb.
The average weight of each web page is 250% of what is was in 2011.
There are any number of statistics I could show you to demonstrate what we as web designers and developers have done to damage the web. I could show you the increasing number of assets we’re using (around 100 per page), the tenfold increase in the use of web fonts, or any number of the 44 data points made available by the HTTP Archive. However, while factual, they’re all abstract.
Try waiting out the typical web page loading in awkward silence. To demonstrate what that feels like, without the payoff of a web page at the end, I’ve created a video at http://pwcc.cc/respond/wait.
When you visit this, you’ll see it’s 4.2 seconds before the page starts rendering, 12.7 seconds before the page is visually complete and 15.2 seconds before the page has fully loaded.
It’s worth remembering this is the average load time on a desktop using a fast, wired connection. On mobile connections, surrounded by EMF interference on a train or a tram, or when connecting to a server overseas, it will be slower.
Why speed matters
As a user, the internet being slow is an inconvenience. We sit on public transport looking at a screen with a blue progress bar apparently going backwards and, after a few moments, we give up and jump over to a competing site.
It’s at this point that performance starts costing you – yes, you the internet professional reading this – money. Without meaning to get all neoliberal trickle-down economics on you, even for the employed reading this, an effect on your company’s bottom line affects how much they can pay you.
Case study after case study has revealed the effect of performance on revenue through declining conversions.
A few years ago, Walmart acknowledged internally that their site had performance issues. These performance issues became particularly apparent on high traffic days – when the opportunity for turnover is at its greatest – such as Black Friday and Cyber Monday. Walmart found their conversion rate declined exponentially as their users waited for the page to load, with the first four seconds being a real killer.
Amazon discovered it would cost them an inhumane amount of money – $1.6 billion in sales annually – were their site to slow down for a mere second. To put that into perspective, in 2013 Jeff Bezos purchased the Washington Post company for 250 million dollars. The one second slowdown would cost them that amount every 55 days.
In percentage terms, Amazon’s drop in sales is 1% for every additional 100 milliseconds of load time. Shopzilla increased revenue by 12% by improving their load time by just a few seconds. Yahoo increased page views by 9% with an improvement of 400ms. And they’re Yahoo!
It doesn’t take a great deal of imagination to see why improving your site’s performance could lead to a tidy little bonus come Christmas time, which is a nice side effect of helping to make the web a better place.
How we measure speed
The facts about performance are all very interesting but, without knowing where your site stands, largely useless. Once you decide to improve performance, you need to check what is slowing down your site to discover where the easier wins are. Why refactor code to save 100 ms if removing a blocking request will save 300?
While you’ll hear people talking about page-speed score as a convenient shorthand (me included), it’s a single number that provides minimal insights.
For more meaningful metrics, WebPageTest is the most convenient tool for measuring the effect of a change. It’s pretty much enter the URL and go. There are a bunch of locations and other settings you can change, but when measuring the effect of a change, consistency is key.
When choosing a browser to test in, I tend to take my lead from Google Analytics. For my own site that means Chrome on iPads and iPhones. For a client site not visited exclusively by middle-class internet professionals, the browser selection may vary.
When you first run WebPageTest, you are presented with some key metrics. The three I consider most important, all related to the user’s experience, are: time to render starting, render completing and the document loading. These are the three I highlighted earlier while we were waiting for the average web page to load.
On WebPageTest, I tend to spend most time looking at the filmstrip view. My biggest concern is how visitors experience the site loading, often referred to as perceived performance. As long as text is readable and calls to action are working within the user’s viewport, it doesn’t really matter what is happening elsewhere on the page.
What causes the delays?
At the time of writing, over 90% of web servers use HTTP 1.1 (w3tech.com). If you work in client services, or on a product installed on client servers, the chances are your work will ultimately be delivered from a server running HTTP 1.1.
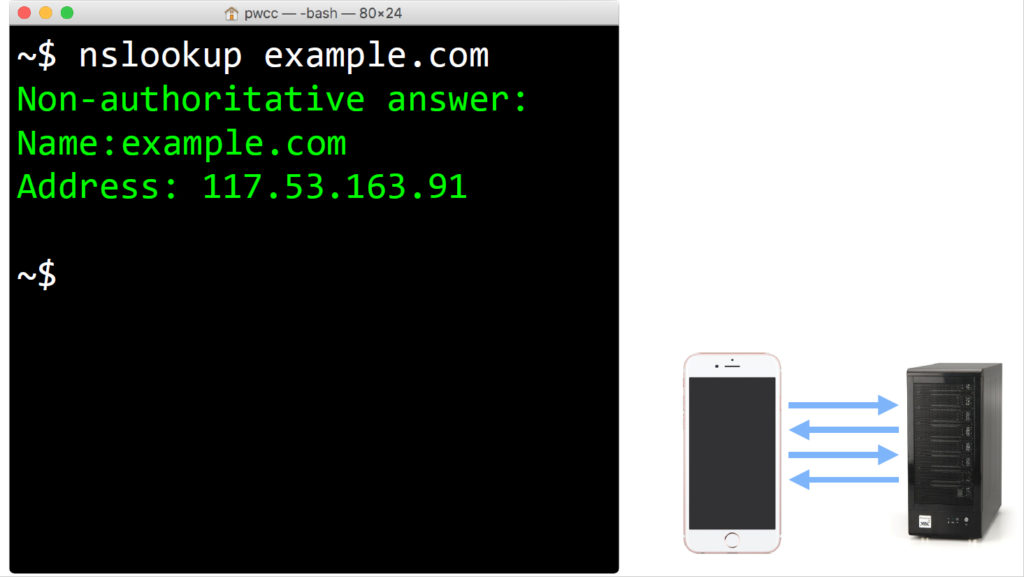
The first step is for the browser to look up the IP address of the server, and for the name server to respond.
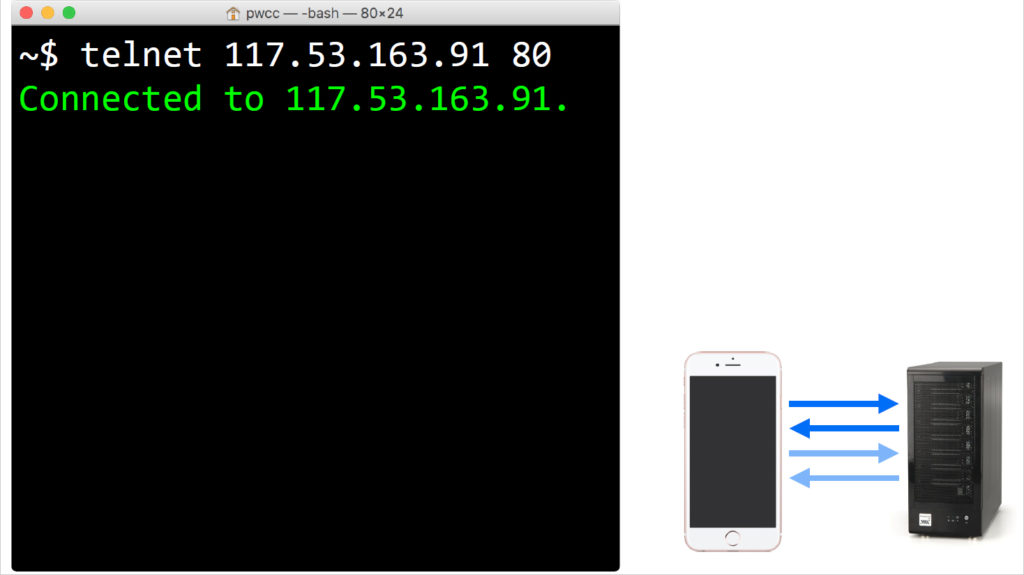
The browser then makes the first of two round trips to the web server by connecting and waiting for the web server to respond with the open connection:
Once connected, the browser requests the web page in a protocol it understands, in this case HTTP 1.1. The browser includes the name of the site as there can be multiple sites on any one server, and the server responds with the web page.
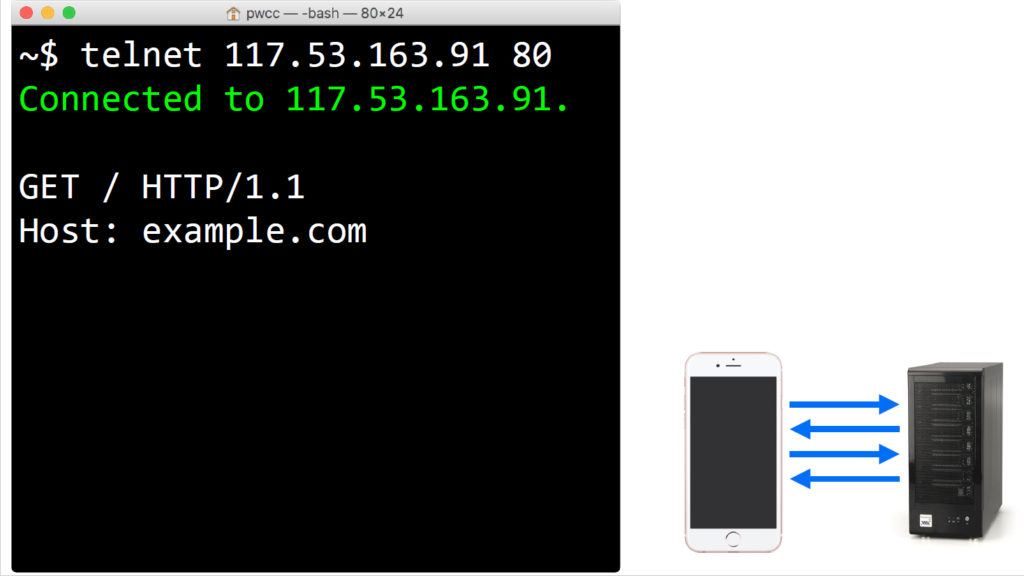
When requesting the web page, the browser includes a bunch of other details we don’t need to worry about when simulating the connection from the command line.
For HTTP 1.1, the browser needs to initiate every connection. It can make multiple parallel connections and reuse them when needs be, but for each connection it needs to go through the original round trip when connecting.
As the browser needs to initiate every connection over HTTP 1.1, the number of assets on a page affects how quickly it can load. The browser needs to download and begin processing the HTML before it knows to download the CSS. Once the browser downloads and starts processing the CSS, it discovers images and other assets it needs to download.
By downloading the images, etc, the browser blocks itself from downloading some JavaScript. While processing the JavaScript, the browser discovers an iframe it needs to load. The browser downloads the iframe (assuming it’s not blocked by other assets) only to discover CSS, images and other assets.
Something had to be done. That something is HTTP 2.
As you research HTTP 2, you’ll come across articles and podcasts telling you it’s time to forget everything you know about performance. I think it’s too early for such grand declarations, when over 90% of web-servers are running HTTP 1.
And if you’re lucky enough to have a site running on an HTTP 2 server, a little under 40% of your visitors will still be stuck using HTTP 1, according to caniuse.com.
HTTP 2 is a binary protocol so, unlike HTTP 1.1, we can’t run the commands in the browser to emulate a connection, we’re limited to describing it. Although it’s not part of the protocol, all browsers currently offering support require a secure connection for HTTP 2. The process is as follows:
1. The first round trip to the server is for the browser to open the connection, and for the web server to respond. As happens in HTTP 1.1
2. On the second round trip, the browser requests details about the server’s SSL certificate, and the server responds with those details. If the server supports HTTP 2, it includes this as additional information in the reply.
3. On the third round trip, the browser calculates an encryption key and sends it to the server. Without waiting for a reply, it starts using the encryption key to request the first asset from the server, the web page the user requested. As the web server has indicated HTTP 2 support, the browser requests it in this protocol.
So far, no real difference from the earlier protocol. It’s once the browser starts processing the page and discovers the other assets, that it finds it can request these over the same connection without waiting for the connection to clear. Instead of three round trips to the server to request the CSS, it takes one. As the browser requests assets, it can continue to request others without other assets blocking the connection.
If downloading a web page was a conversation, HTTP 1.1 would be over a CB radio allowing only one person to talk at a time; whereas HTTP 2 would be a crowded room with multiple conversations happening in one place at any one time.
Where HTTP 2 really provides a performance boost is with HTTP 2 server push. This is a technique in which both the browser and the server can initiate sending a resource across the wire. This allows the server to include the CSS and other files when a browser requests the web page.
Including an asset via server push is incredibly easy. The convention is to trigger the browser to send the additional resource using a link in the HTTP header. In PHP (the language I usually use), this becomes:
if ( is_http2() ) {
	// Set HTTP Push headers, do not replace
header( 'link:;	rel=preload', false );
header( 'link:; rel=preload', false );
}
However, this presents a problem. It instructs the server to push the two additional files on every load, without considering the state of the browser cache. If the files are in the browser’s cache, our efforts to speed up our website’s load time have resulted in unnecessary data being transmitted.
Server push is unsophisticated; it lacks the smarts to determine if a file is in the browser’s cache. Browsers can cancel the transmission but by the time they do, the server has already started sending data down the line.
The solution is to check if the file is cached in the browser and only push the file if it is not:
if ( ! is_cached( '/style.css' ) ) {
  header( 'link:; rel=preload',    false );
}
Regrettably, there is no is_cached function in any programming language to check if the browser is caching a file. It’s not something the browsers report, and for security reasons nor will they.
if ( ! is_cached( '/style.css' ) ) {
  header( 'link:; rel=preload',    false );
  setcookie( '/style.css', 'cached', 0, '/' );
}
To fake the cache detection, we need to set a cookie indicating the file is likely to be in the browser cache. In this example I’m setting the word cached to test against, if the file version changes regularly, then you may want to use the version number.
function is_cached( $filename ) {
  if ( 'cached' === $_COOKIE[ $filename ] ) {
    return true;
  }
  else {
    return false;
  }
}
Our function is_cached becomes a check for the existence of a cookie against the file name. I’d write some additional code for a production version, and as a first step I’d hash the file name, but exactly what the code would look like depends on the site specifics.
What the transition to HTTP 2 means
Over the next two or three years, to keep our sites performant, we’re all going to have to consider the impact of every byte we put on the page.
Once we have an HTTP 2 enabled server – and we should all argue for this to happen sooner rather than later – we have to think how bytes on the page impact visitors to a site on a fast or slow connection, and to think about the impact under both HTTP versions 1 and 2.
At times it will be annoying, at times frustrating, but it will keep our jobs interesting.
And that’s why I love working in the industry we do.
Great reading, every weekend.
We round up the best writing about the web and send it your way each Friday.